|
Processing Histories |
|
|
|
|
|
|
|
Each time a process is executed on a view in PixInsight —either an image or a preview—, a duplicate of the process instance is appended to the view's processing history. When the undo operation is applied to an image or preview, the last executed process is temporarily removed from the history; it is added again if the redo operation is applied. A processing history is a chronologically ordered sequence of the processes that have been applied to a particular view. Processing histories are automatically managed as processes are being applied, but the user cannot modify them directly. However, PixInsight gives you tools to generate detailed reports of processing histories, to inspect them, and to put them into instances of the ProcessContainer process, which can be managed as independent objects and fully edited.
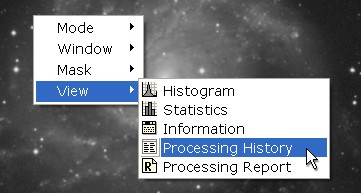
To directly accessing a view's processing history, right-click it and select the corresponding option form the View context menu:
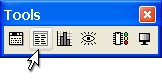
This will open the Processing History window, which will load the current view's processing history automatically. In addition, you can open the Processing History window from the Tools Tool Bar:
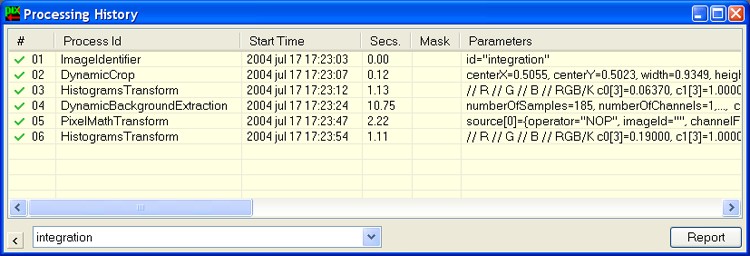
and also from the and main menu items. When you have a view's history loaded in the Processing History window, it looks like this:
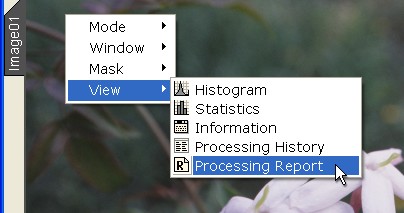
Note that the Processing History window is actually a processing window, including a process drag object and a view selection list. If you have no idea of what we're talking about here, better review the documentation on processing windows before going ahead. The Processing History window is an interface to the ProcessContainer process. This means that you can generate process icons, drag a process to any view, etc., just as usual with most processing windows in PixInsight. The Processing History window is basically a list of the processes included in a view's processing history. You can double-click any list element (but not on the first column) to edit a copy of the process associated with that element. For example, by double-clicking the third line of the list shown above, the Histograms window would be activated and loaded with the parameters of the third process instance of the processing history shown. The first column of the list tells the position of each process in chronological order. You can enable and disable a process by double-clicking on the first column. By disabling a process this way, you are not removing it from the view's history, since processing histories are read-only objects; you are simply disabling it in the process instance that you can apply with the window's process drag object. The rest of list columns are self-explanatory. The number of seconds shown is the total execution time employed to execute each process. Mask is the identifier of the image used to mask each process, and is blank if no mask has been used. Finally, the Parameters column gives a summary of the parameters used by each process, but does not show all of them in detail. You can see an exhaustive report of any view's processing history, including every process applied and its parameters in full detail, on the Processing Report window. To access a view's report, click the Report button on the Processing History window (when the view is selected in that window, see the preceding section), or right-click the view and select the appropriate option from the View context menu:
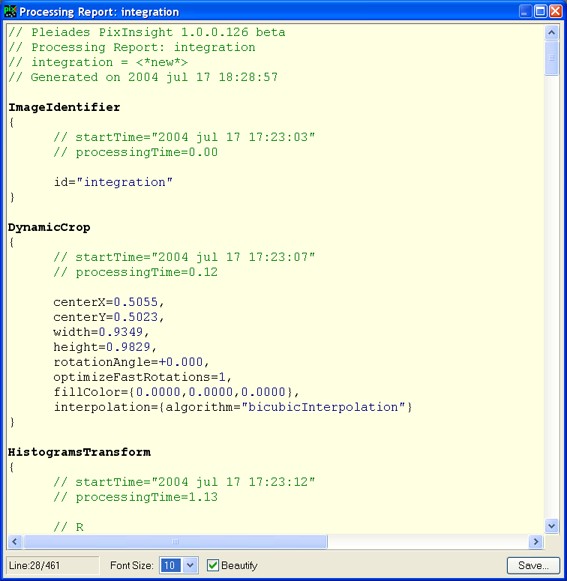
The Processing Report window is also used to reporting independent ProcessContainer instances from the Process Container window. Processing Report is a modal window, that is, you must close it to continue. Here is an example of a typical processing report:
The information given on the Processing Report window follows the syntax rules of a special scripting language that is still under development at the date of releasing this documentation. If the Beautify option is selected, a special syntax highlighting algorithm is applied to the text. You can also change the font size employed and save the report either as a Rich Text Format document (.rtf) or as a plain text file (.txt). |