|
Understanding the Multiscale Language |
|
|
|
One Data Set, Many Different Data Scales |
||||||
|
|
||||||
|
Imagine a large data set consisting of temperature measurements registered hourly at a given place on the Earth during a long period, say for the last 500 years, for example —of course such a treasure doesn't exist, but we're just using our imagination here. Now we manage to plot the whole data set on a really long graphic so we can see temperature variations as a function of time. By simply having a look at any point on the graphic, we'll become aware of a periodic fluctuation at exactly one-day intervals: expressing time in the Universal Time scale, temperature reaches a daily maximum, roughly at noon, and a minimum during the night, some hours before sunrise. This repeats every day, perhaps with a few, statistically irrelevant exceptions, where temperature is nearly constant during a whole day. But, how about analyzing temperature data at larger intervals? If we can get a sort of "window" —say just a hole on a paper sheet— to study the graphic at one-year intervals, again we'll observe a periodic fluctuation: a maximum during summertime and a minimum during winter, and this repeats every year. We can use a wider window to study variations at larger scales, for example at intervals of ten years, fifty years, one century, and so on. Perhaps we'd discover interesting properties of the temperature data set, as large-scale climatic variations, or even variations at smaller scales that would correlate reasonably well with observed solar activity cycles. At the largest scale, maybe we could find what we're afraid of: an overall stability, broken by an increasingly growing tendency some 80 years ago, acquiring a more rapid growing rate during the second half of the 20th century. In more general terms, our temperature data set is a temporal series, that is, a stream of discrete data items varying as a function of time. All of the variations that we've described for a temperature data set are characterized by their scale in temporal units: daily, yearly, at intervals of some years, at century intervals, etc. We can think of these variations as structures of a given size. The entire 500-years data stream is a big information object composed by many superposed structures of many different sizes. Our data windows have been useful tools to isolate structures at specific scales.
Now transport these ideas to the world of two-dimensional images. Instead of having a single stream of data items as a function of time, what we have is a set of picture elements (pixels) as a function of distances measured on a plane. This is a two-dimensional spatial series. Time and coordinates on a plane don't seem two very well related things at first sight. However, if we analyze the visible features in an image according to their relative sizes —relative to the dimensions of the image—, and the observed temperature phenomena according to their relative duration —relative to the time span covered by the temporal series—, in both cases we are talking in terms of characteristic scales. Scale is the key word here. On images, many different structures at many different scales are also, as occurs with temperature, superposed: dim and bright stars are mixed over larger nebulae, which in turn can be projected over much larger Milky Way regions, etc. Even the image of a single star comprises various superposed scale components: the whole star disk occurs at a larger scale than its edges, which form sharp features (discontinuities) defined within very small scales.
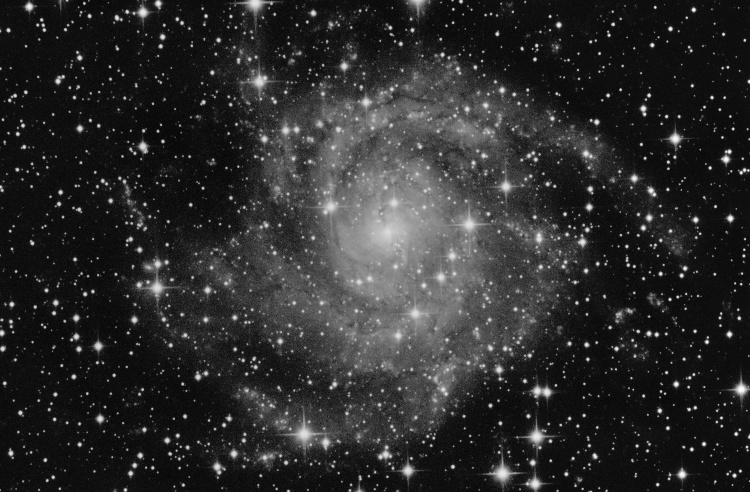
Wavelets are mathematical functions used to split data sets into different scale (or frequency) components in a hierarchical manner. This decomposition procedure is called a wavelet transform. At this point, an example will help you to fully understand how this actually works. The following figure shows IC 342, a wonderful spiral galaxy in Camelopardalis. We have performed a wavelet transform on this image, decomposing it into seven separate components at increasing characteristic scales. The following links allow you to explore individual components by placing the mouse cursor over them.
As you can see, larger scales contain bigger structures. For example, there is virtually no data describing galaxy arms in the scales below four pixels. The spiral shape becomes evident at the scale of 32 pixels, because the spiral arms in this image are essentially large-scale structures. Once data are decomposed into different scales, we can isolate structures at particular scales of interest and analyze or modify them without affecting structures at other scales. We then can apply a reverse wavelet transform to join all of the scales together and recompose a wavelet-processed image. This is known as a multiscale (or multiresolution) analysis processing technique.
In the example above, some scale components of the image have been enhanced selectively. To enhance a particular scale, we simply multiply the data it contains by a number greater than one. This increases the relative weight of the scale in question when the reverse wavelet transform recomposes the image. By enhancing small-scale components, stars and other small image structures —including noise— have been improved in their contrast without altering the galaxy's overall shape. By enhancing large scales only, on the other hand, the spiral structure and galaxy arms have been given more importance, but small stars and sharp details haven't been changed at all. With wavelets we can see the forest, the trees, and even the grass, all at the same time. Then we can cut the grass and make the trees grow. |