|
The Histograms Window |
|
|
|
Zooming and Panning Controls and Functions Zooming and Panning with Temporary Keyboard Switching Combinations Obtaining Pixel Readouts on Histograms Selecting Channels on the Histograms Window Clipping Values and Clipping Counts |
||||||||||||||||||||
|
|
||||||||||||||||||||
|
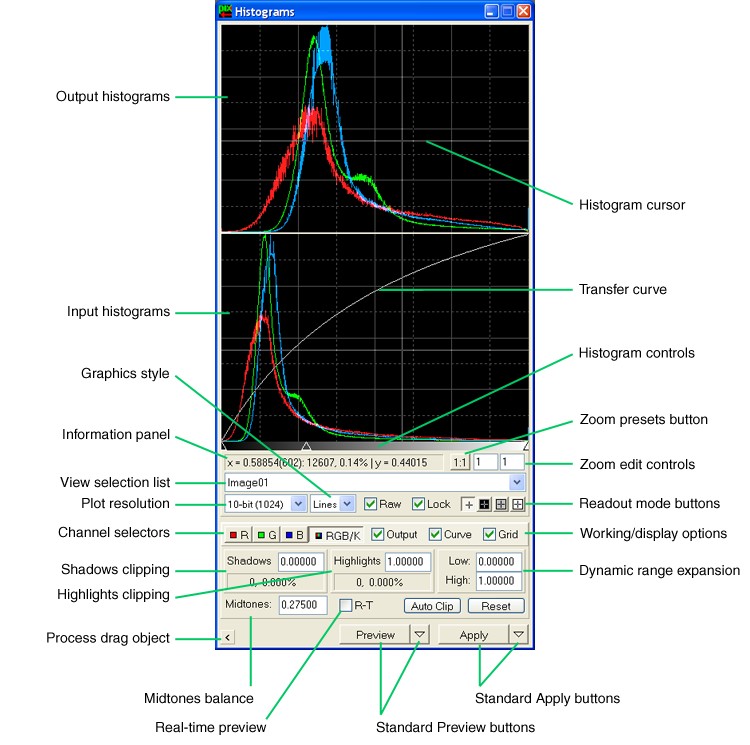
But perhaps the most complex user interface subsystem in PixInsight has been built around the histogram manipulation task. This is the Histograms window, the standard interface for HistogramsTransform:
Despite the apparent complexity, the Histograms window is a rich yet easy-to-use tool, as you'll learn through the rest of this document.
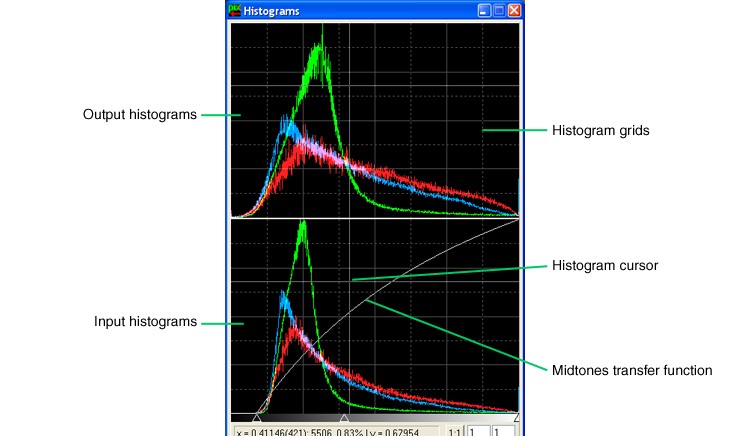
When a view is selected in the view selection list, its histogram functions are drawn. Input histograms are actual functions calculated for the currently selected view. For RGB color images, when the combined RGB/K channel is selected and the Raw working option is not active, input histograms may reflect variations due to possible changes made to parameters for individual RGB channels. If the Raw working option is selected, input histograms don't take into account possible changes made to parameters of individual RGB channels, and the input histograms are just the actual histogram functions as calculated for the current view in its current state. Output histogram functions are predicted according to the whole set of parameters, as currently defined on the Histograms window. Since output histogram functions are necessarily predicted from interpolated data, in rare occasions you might find very small differences between predicted values and the resulting histogram values after applying or previewing the histogram transform. You can choose whether to use output histograms by clicking the Output check box. Similarly, the Curve and Grid check boxes control visibility of the midtones transfer curve and coordinate grids, respectively. These controls are covered later by this document.
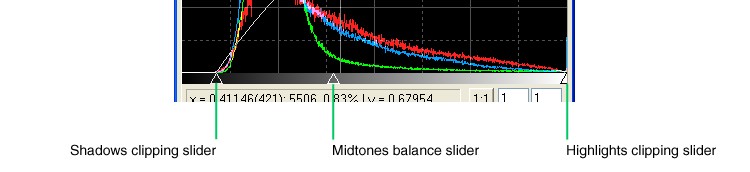
To the bottom of the input histograms there is a horizontal rectangular area whose background is drawn as a gradient, ranging from pure black to pure red, green, blue or white, depending on the currently selected channel. This gradient represents the full available dynamic range, and is oriented as pixel values vary for histogram functions, transfer curves and readouts. Three small triangular shapes, known as sliders, are shown ordered on this area and are associated with their respective histogram manipulation parameters, namely, from left to right: shadows clipping, midtones balance and highlights clipping. You can click on any slider and drag it horizontally to change its associated parameter. Both clipping sliders can vary within the full normalized dynamic range (from 0 to 1), with the restriction that shadows clipping must always be less than or equal to highlights clipping. The midtones balance slider is limited to the range defined by both clipping controls, and can take relative values in the range from 0 to 1. Each slider is associated to its own edit control counterpart. Numerical values shown on these edit controls and relative slider positions are mutually linked and automatically updated to ensure total coherence between interface objects and process parameters. The same is true if you have the Output check box checked: output histograms are updated as you move a slider. When you move the midtones balance slider, the midtones transfer function is recalculated and redrawn if the Curve check box is checked. When any of the clipping sliders are moved, the clipped pixel counts are recalculated and updated:
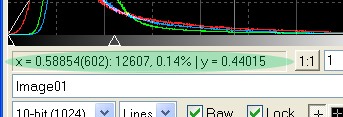
This panel shows information associated with the current cursor position over the input or output histograms. For example, on the figure above, the information panel is showing the following text string:
which should be interpreted as follows:
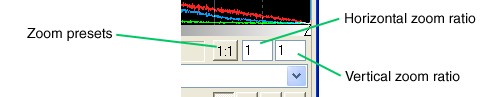
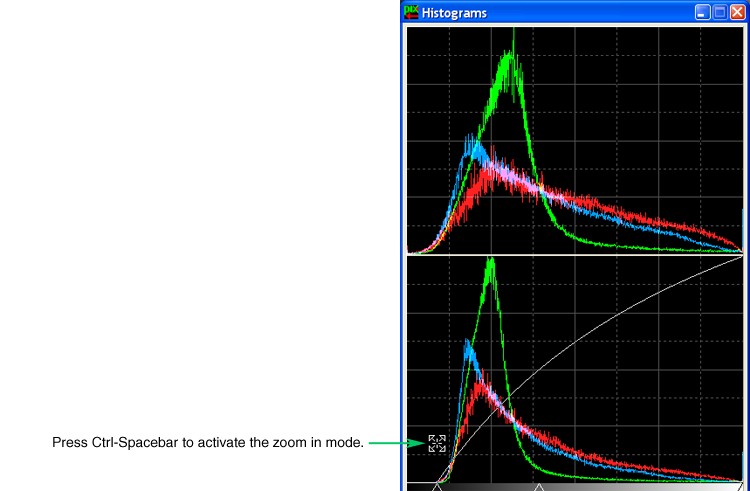
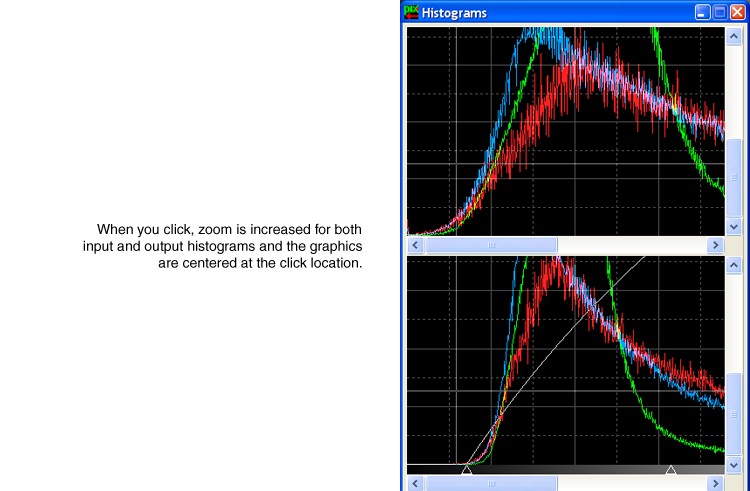
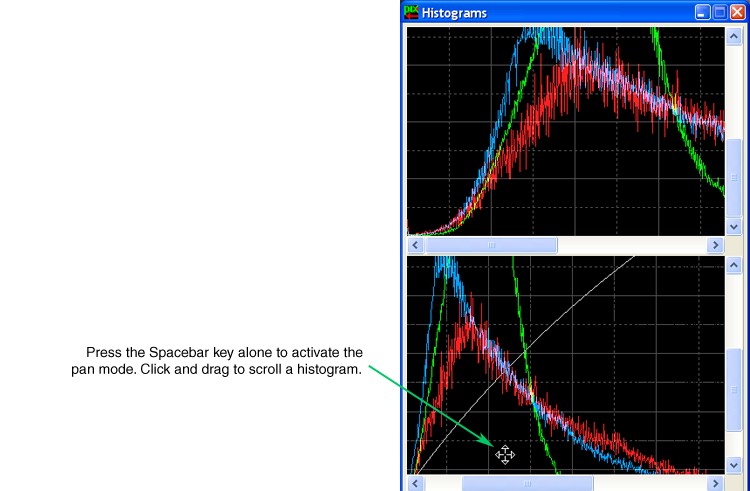
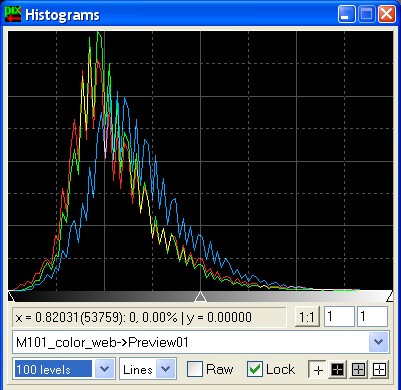
Histogram functions can be quite complex and sometimes very difficult to read. For example, most raw CCD images concentrate a large amount of data in a sharp peak near the histogram's left end. In other cases, there are large amounts of pixels with identical or nearly identical values, responsible of strong vertical peaks on the histogram, which in turn causes many difficulties to observe the true shapes of histogram functions. Or maybe you want to read and graphically compare a set of individual values over a histogram represented with 16 or 12 bits resolution, and the relatively small sizes of the paint boxes used to draw histogram functions don't suffice. To fix these situations, we have implemented a dual zoom feature on the Histograms window. Zoom ratios can be independently adjusted for horizontal and vertical axes from 1:1 to 999:1. Note that zoom ratios affect every element of the graphical histogram interface: histogram functions, midtones transfer functions, clipping and midtones slider positions and available screen range, grids, etc. When a value greater than 1 is specified for horizontal or vertical zoom, scroll bars appear on the bottom or right edges, respectively, of the input and output histograms. You can use these scroll bars and their associated scroll thumbs and arrows to navigate on the magnified histogram. You can also navigate zoomed histograms by temporary keyboard combinations, as explained below. The zoom presets button resets zoom ratios to 1:1 (no zoom) by default. When the Ctrl key is pressed, the zoom preset changes to 2:1, and if Shift-Ctrl is pressed, the zoom preset changes to 4:1. Note that the button caption varies as you press these keys.
Zooming/panning keyboard combinations in image windows and on the Histograms window work in a very similar way:
As you see, the keys are exactly the same used to navigate image windows:
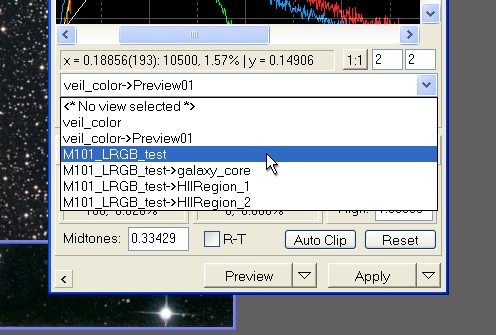
Here you can select an existing view to work with its histograms on the Histograms window. Any image view or preview can be selected. You might want to read a general discussion on view selection lists if you already haven't done so. Immediately after a view is selected on the Histograms window, the program checks for availability of the associated histogram resources, and if not found, they are automatically generated and the histogram functions are calculated. Then the involved graphical elements are updated. Once you have selected a view on the Histograms window, automatic recalculation and redisplay of its histogram functions takes place each time any pixel value is changed. For example, if you apply an unsharp mask transform to the view that is currently selected on the Histograms window, histograms are recalculated and graphically updated just upon unsharp mask completion. This is very useful to account for image data transformations without the need of manual intervention. It is very important to point out the fact that the Histograms window, despite its appearance, is actually an image-independent interface, as every processing window in PixInsight. This means that you don't need to have an image selected to define a valid histogram transform on the Histograms window. You don't even need to have an open image. The above paragraph explains why the first item of the view selection list is to unselect the current view, leaving the Histograms window with no specific view selection. There is a main reason for which you may want to have no view selection on the Histograms window: saving processing time and resources needed for automatic recalculation of histograms when a selected view is changed by another process.
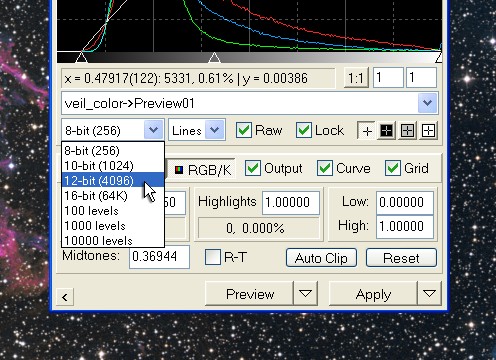
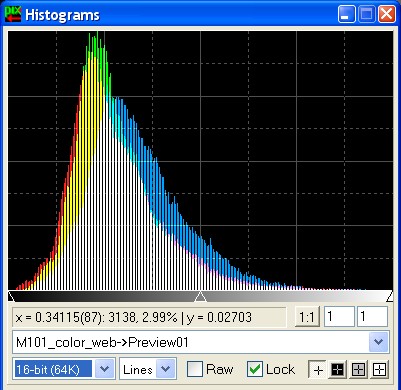
Histograms are calculated with 16-bit accuracy in PixInsight. Since PixInsight works internally with normalized IEEE 32-bit floating point pixel values, this means that 65536 different levels are used to discretize pixel values in the 0.0 to 1.0 normalized floating point range for histogram calculation. If you select a plot resolution smaller than 16 bits on the Histograms window, histogram values are once more rescaled to the specified range before drawing the histogram functions. Available plot resolutions include the popular 8-bit (256 values), 10-bit (1024 values), 12-bit (4096 values) and 16-bit binary ranges, plus three decimal ranges of 100, 1000 and 10000 values. Limitations inherent to the 32-bit IEEE floating point representation, rounding and truncation errors that inevitably occur in processing routines, and the normalized range restriction, impose an effective available dynamic range of 5x10⁵ to 1x10⁶ different values in PixInsight, depending on the number and complexity of the applied processes. These numbers are well beyond the 16-bit resolution. Why would you decide to use a specific plot resolution with a particular image? Simply put, to adapt the graphical representation of histogram values to actual image contents. For example, if you use 16-bit resolution histograms with an 8-bit image you'll probably get a very unpleasant and poorly represented histogram, since there is only a unique pixel value in the image for each 256 levels in the plotted histogram function. For images already processed in PixInsight, or for native 16-bit or floating point images, 12-bit or some high decimal resolution can be quite appropriate. The full 16-bit resolution is less frequently used, since its large number of values becomes quite unpractical in most cases, but is necessary for thorough evaluation of histograms with full accuracy. Generally speaking for real world astronomical images, if the histograms of your final image show no frequent gaps at 12-bit plot resolution, you can be happy with the effective dynamic range achieved.
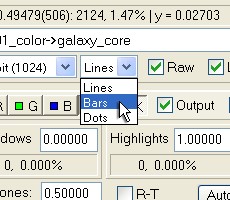
You can select lines, bars or dots to draw histogram functions. The availability of these options is very useful sometimes to help viewing the true general shape of complex histograms.
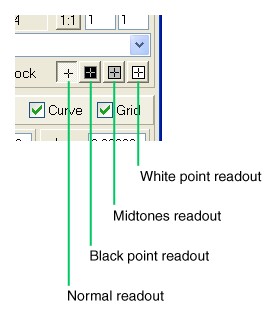
Readouts work by clicking on any view (image or preview) of an image window in the Readout Mode. In this mode, while the mouse button is held down, readout values are calculated for the cursor coordinates and sent to the Histograms, Curves and Color Saturation windows. On the Histograms window, you can choose how readout pixel values are used. In the normal readout mode, readout values are simply shown over histogram functions but no parameter is changed. In the black point readout mode, readout values are used to set shadows clipping parameters for individual RGB channels, when the selected view is a color view, or for the RGB/K combined channel if the view is grayscale. Similarly, in the midtones and white point readout modes, midtones balance and highlights clipping values are set, respectively, to match readout values. The way readout values are calculated is governed by the current readout options settings.
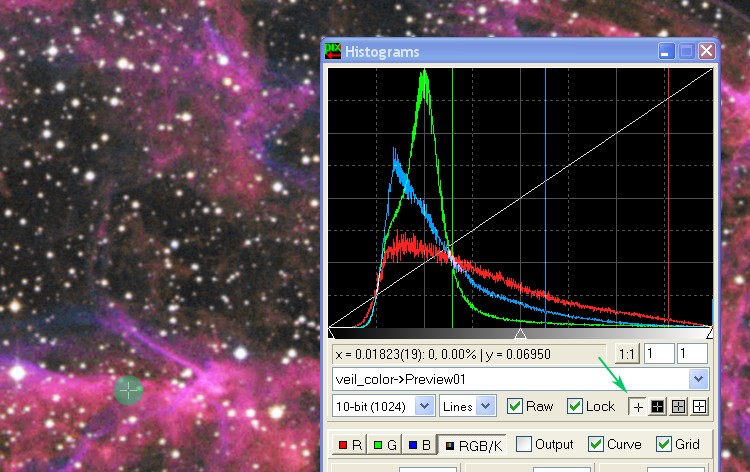
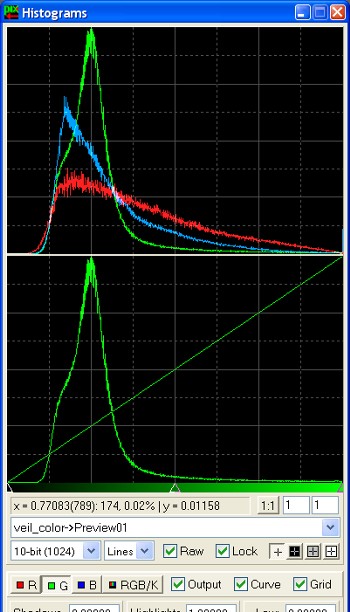
Normal histogram readout mode. The image view is in the readout mode (you know this by the '+' cursor shape over the image), and the normal readout mode button is selected in the Histograms window. When the mouse button is held down, three vertical lines are drawn on the histogram graphic, indicating readout pixel values corresponding to individual RGB channels. No histogram adjustment parameter is changed.
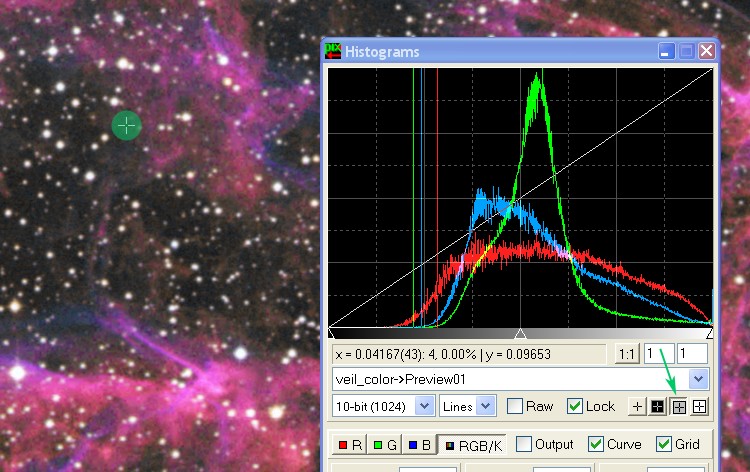
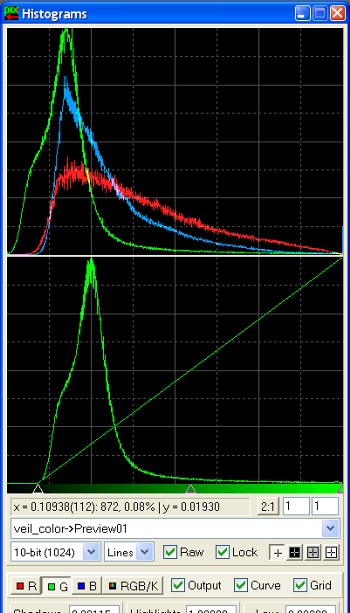
Midtones histogram readout mode. As before, when the mouse cursor is held down over the view, three vertical lines are drawn corresponding to individual RGB readouts. This time, however, the midtones readout mode button is selected, so the midtones balance parameter is automatically changed for each individual RGB channel, according to readout pixel values. Note the disabled Raw check box, which causes real-time recalculation and update of input histogram functions as the mouse cursor moves over the view.
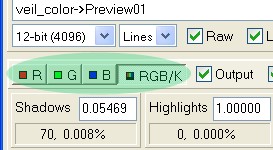
On the Histograms processing window you can define independent histogram manipulations for red, green, blue and combined RGB or grayscale channels. Transforms defined for the red, green and blue channels are applied to the same channels of RGB color image views. For RGB color image views, the combined channel transform applies equally to the three channels. For grayscale image views, only the combined channel transform (whose corresponding channel selector is labelled as RGB/K) applies.
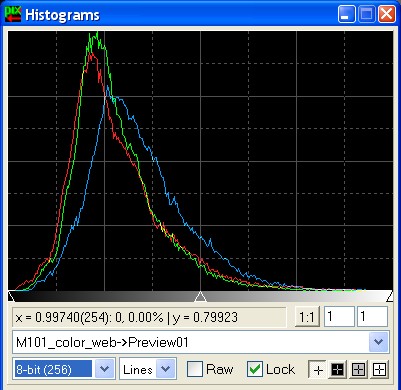
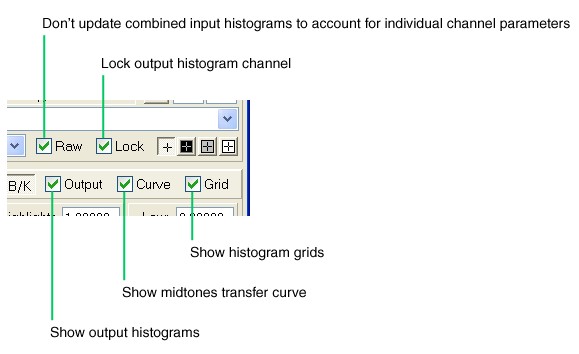
The "show" check boxes control whether to display different graphical elements, as indicated. When the Show Output check box is checked, the Histograms window expands to make room for the output histograms graphics port. When the "Lock" check box is checked, displayed channel(s) for the output histograms don't change when you change the current channel for input by clicking channel selection buttons. This is useful to see how changes to an individual channel affect the output histogram by comparison with the rest of channels. The following example shows this better.
When the "Raw" check box is checked, changes to parameters for individual RGB channels are not taken into account to draw the histogram functions in the combined RGB/K channel. In this case, the functions plotted are just the histograms of the selected view in its current state. When the Raw check box is unchecked, individual RGB parameter sets are used to calculate modified histogram functions in the combined RGB/K channel.
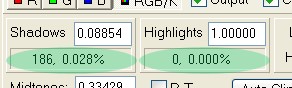
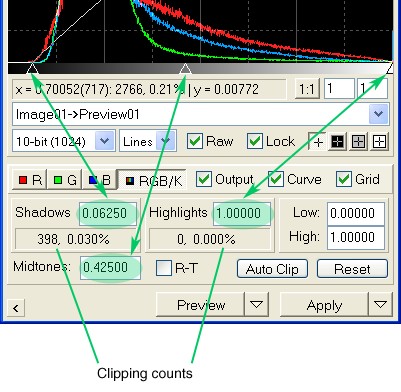
Shadows and highlights clipping parameters as well as midtones balance can be edited either by typing numerical values or by moving their corresponding triangular sliders. Histogram manipulation parameters are defined in the normalized real dynamic range, that is, from 0 to 1. The edit controls implement the standard PixInsight's parsing procedures to ensure that you always specify strictly valid numerical values within the valid range. An additional constraint guarantees that the value of shadows clipping is always less than or equal to highlights clipping. Note that each edit control is tied to its corresponding triangular slider control. The program updates both kind of controls simultaneously to ensure coherence between interface objects and transformation parameter values. Clipping counts refer to the number of clipped pixels at both histogram ends. Clipped pixels at the shadows will be set to zero (black), while clipped pixels at the highlights will be set to one (white). Information from clipped pixels is always lost. Whether shadows clipping is acceptable or not depends on S/N ratio. Highlights clipped pixels are mostly unacceptable in astrophotographical images. On specific documentation sections you'll find detailed explanations on the clipping and midtones balance parameters.
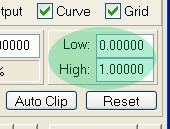
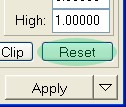
These controls let you enter values for low and high dynamic range expansion parameters. For a detailed explanation on how these parameters work in PixInsight, see a specific documentation section.
By clicking the Reset button, all parameters for the currently selected channel are reset to default values. If the Ctrl key is pressed while clicking the Reset button, the whole parameter set is reset, for all of the RGB and combined RGB/K channels. Default parameter values are as follows:
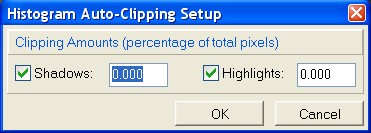
The Auto Clip button automatically clips histograms by predefined amounts. If the currently selected view is an RGB color image, automatic clipping occurs for each individual RGB channel. For grayscale images, automatic clipping works for the RGB/K combined channel only. The predefined clipping amounts can be established by pressing the Ctrl key while clicking the Auto Clip button. When you do so, the Histogram Auto Clipping Setup dialog is shown:
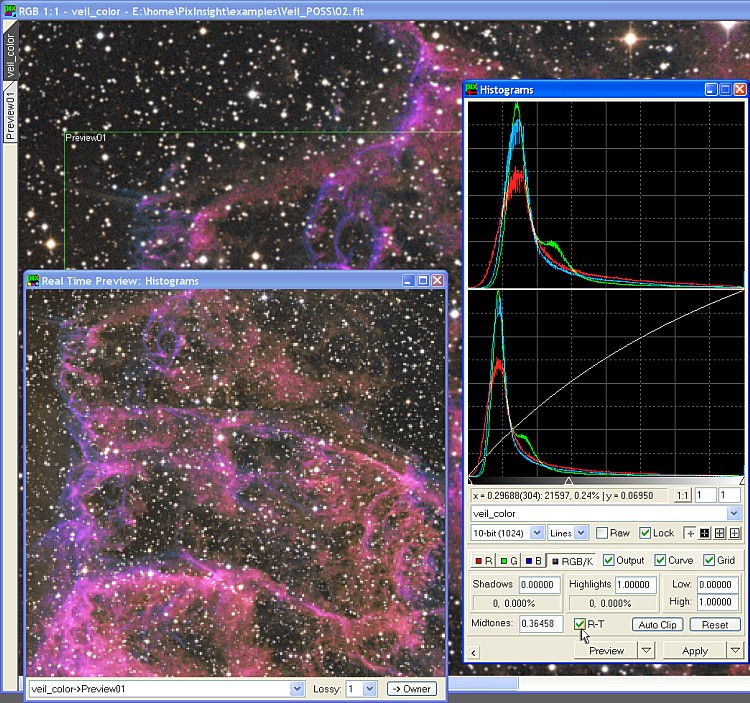
In this dialog you can define whether to clip at each histogram end, and the amount of pixels that will be automatically clipped. Amounts are expressed as percentages of the total number of pixels in the target image. Default values are: shadows and highlights clipping enabled, 0% pixels clipped. These settings will only clip unused segments of dynamic range at both ends of histograms. If you check the R-T check box, the Histogram window will gain ownership of the Real Time Preview window, which this way will show in real time how changes made to histogram parameters would affect a selected view. In PixInsight LE 1.0, the real-time preview system works for the Histograms and Curves windows exclusively. Below is a screenshot showing the Real Time Preview window working for Histograms. With the setup shown, changes to histogram parameters will be automatically reflected on both the output histogram graphic and the real-time preview.
By checking and unchecking the R-T checkbox, you can turn real time preview on/off to quickly evaluate changes. |
||||||||||||||||||||